Showing posts with label stock. Show all posts
Showing posts with label stock. Show all posts
Saturday, May 17
More Interesting Javascript Libraries
JQuery - Spark Lines - http://omnipotent.net/jquery.sparkline/#s-about - free
Peity - Spark Lines - http://benpickles.github.io/peity/ - free
SigmaJS - Draw Graphs/Node Map - http://sigmajs.org/ - free (might be nice to draw an AI's node interface)
D3js - Just cool - http://d3js.org/
http://www.profitspi.com - Stock Analyser Site
Jquery Dashboard Library - http://cube3x.com/sdashboard-simple-jquery-dashboard-plugin/


Saturday, May 10
Stock Charting Library
A few stock charting libraries and their cost
This is in order or my preference and I typically like free *grin*
HumbleFinance - http://www.humblesoftware.com/finance/index - free
Uses Flotr and Prototype
Dcjs - http://nickqizhu.github.io/dc.js/ - Free but uses svg not compatable with IE 8 or lower
HighCharts - http://www.highcharts.com/stock/demo/ - The best around but runs around $1,000
Dygraphs - http://dygraphs.com/ - seems to be free
AnyCharts - http://www.anychart.com - $399
AmCharts - http://www.amcharts.com/demos/multiple-data-sets/ - $150
Koolchart - http://www.koolchart.com/ - $600
JsCharts - http://www.jscharts.com/examples - $79
ZinCharts - http://zingchart.com/gallery/ - $2500
Fusion Charts - http://www.fusioncharts.com/buy/ - $3000 and higher
This is in order or my preference and I typically like free *grin*
HumbleFinance - http://www.humblesoftware.com/finance/index - free
Uses Flotr and Prototype
Dcjs - http://nickqizhu.github.io/dc.js/ - Free but uses svg not compatable with IE 8 or lower
HighCharts - http://www.highcharts.com/stock/demo/ - The best around but runs around $1,000
Dygraphs - http://dygraphs.com/ - seems to be free
AnyCharts - http://www.anychart.com - $399
AmCharts - http://www.amcharts.com/demos/multiple-data-sets/ - $150
Koolchart - http://www.koolchart.com/ - $600
JsCharts - http://www.jscharts.com/examples - $79
ZinCharts - http://zingchart.com/gallery/ - $2500
Fusion Charts - http://www.fusioncharts.com/buy/ - $3000 and higher
Saturday, May 3
Best Stock Charting Sites:
These sites seem to be stock charting right
http://stockcharts.com/h-sc/ui?s=AAPL
http://bigcharts.marketwatch.com/
http://www.freestockcharts.com/
Wednesday, September 11
Evaluation of Trader
I was watching this thread over at HotStockMarket, thought I'd make some notes on how accurate this fella Binks was:
Some disclaimers: This is a paper trade, I did not actually make these trades. It is impossible for me to get in and out exactly when he is, therefore, anytime he made a post on the thread, I assume that I bought at the open price on the following day of the post. Obviously, this could lead to some major differences in profit.
8/27/13 - GGS - in at 2.70, At 2.64 on 9/5 = 2% loss
8/28/13 - AStx- in at 6.39 on 8/29, At 8.61 on 9/5 = 34% profit
8/29/13 - NVA - in at 3.22 on 9/3, At 3.23 on 9/5 = 1% profit
8/23/13 - AMRN - in at 6.10, At 7.36 on 9/5 = 20% profit
8/26/13 - MXWL- in at 9.47, At 9.00 on 9/5 = 5% loss
8/26/13 - STSI - in at 2.03, At 1.93 on 9/5 = 4.9% loss
8/26/13 - YRCW in at 17.50, At 17.65 on 9/5 = .8% gain
8/16/13 - AMRN in at 6.01, At 7.37 on 9/5 = 22% profit
8/19/13 - ASTX in at 5.25, At 8.64 on 9/5 = 64% profit
8/13/13 - RAD in at 3.60, At 3.53 on 9/5 = 1% loss
8/14/13 - PCO in at 2.00, At 1.88 on 9/5 = 6% loss
8/14/13 - AMRN in at 5.14, At 7.36 on 9/5 = 32% profit
7/8/13 - AMD in at 4.40, At 3.56 on 9/5 = 20% loss
7/18/13 - HPQ in at 26.33, At 22.52 on 9/5 = 15% loss
7/15/13 - GTAT = 35% profit
7/15/13 - ICA= 10% profit
7/15/13 - AGNC = 3% loss
7/15/13 - MAKO= 22% profit
7/11/13 - ITMN = 14% profit
7/11/13 - ECTE = 1% profit
Conclusion:
Some disclaimers: This is a paper trade, I did not actually make these trades. It is impossible for me to get in and out exactly when he is, therefore, anytime he made a post on the thread, I assume that I bought at the open price on the following day of the post. Obviously, this could lead to some major differences in profit.
8/27/13 - GGS - in at 2.70, At 2.64 on 9/5 = 2% loss
8/28/13 - AStx- in at 6.39 on 8/29, At 8.61 on 9/5 = 34% profit
8/29/13 - NVA - in at 3.22 on 9/3, At 3.23 on 9/5 = 1% profit
8/23/13 - AMRN - in at 6.10, At 7.36 on 9/5 = 20% profit
8/26/13 - MXWL- in at 9.47, At 9.00 on 9/5 = 5% loss
8/26/13 - STSI - in at 2.03, At 1.93 on 9/5 = 4.9% loss
8/26/13 - YRCW in at 17.50, At 17.65 on 9/5 = .8% gain
8/16/13 - AMRN in at 6.01, At 7.37 on 9/5 = 22% profit
8/19/13 - ASTX in at 5.25, At 8.64 on 9/5 = 64% profit
8/13/13 - RAD in at 3.60, At 3.53 on 9/5 = 1% loss
8/14/13 - PCO in at 2.00, At 1.88 on 9/5 = 6% loss
8/14/13 - AMRN in at 5.14, At 7.36 on 9/5 = 32% profit
7/8/13 - AMD in at 4.40, At 3.56 on 9/5 = 20% loss
7/18/13 - HPQ in at 26.33, At 22.52 on 9/5 = 15% loss
7/15/13 - GTAT = 35% profit
7/15/13 - ICA= 10% profit
7/15/13 - AGNC = 3% loss
7/15/13 - MAKO= 22% profit
7/11/13 - ITMN = 14% profit
7/11/13 - ECTE = 1% profit
Conclusion:
- 20 Picks over last 2 months
- Gainers: 11
- Losers: 8
- Profit: 196%
Thursday, April 22
Stock Guessing - Programatically
I've always been interested in stock analytics. Mostly because I have this un-reasonable dream that if I can program a stock "machine" which will trade stocks for me and make me richer than my wildest dreams.
*Watches as you fall on the floor laughing*
So now that you are done laughing....I started a blog about a year ago on creating such a program. If your interested it's here. I don't think I'm going to post to it anymore and it..."wonders"...a bit.
Last night, I fired up the old program I wrote and tinkered with it for a little while. Tormenting myself with that dream I mentioned. To my surprise, I found something interesting...
The program is setup to run once a day, pick a few stocks and then invest $1,000 into it. It then examines it's buys every day and sells the stock. There is a lot of other stuff going on, but that's the important part.
If I had $10,000 to invest over the past 60 days and I had done ever trade and sell recommended by the program. I'd have gained $3,679.02.
I'd have done 33 trades, assuming a $10 commission on each buy and sell, the commissions would cost me $660.
The program churns through around 3,500 stocks (NYSE and NASDAQ) looking for good trades. It's a lucky day when it finds two picks in a given day.
For those who are interesting..here are the last 10 or so picks it spit out.

I'm at a loss on how to further test the program to ensure this is not some coincidence. Any suggestions?
*Watches as you fall on the floor laughing*
So now that you are done laughing....I started a blog about a year ago on creating such a program. If your interested it's here. I don't think I'm going to post to it anymore and it..."wonders"...a bit.
Last night, I fired up the old program I wrote and tinkered with it for a little while. Tormenting myself with that dream I mentioned. To my surprise, I found something interesting...
The program is setup to run once a day, pick a few stocks and then invest $1,000 into it. It then examines it's buys every day and sells the stock. There is a lot of other stuff going on, but that's the important part.
If I had $10,000 to invest over the past 60 days and I had done ever trade and sell recommended by the program. I'd have gained $3,679.02.
I'd have done 33 trades, assuming a $10 commission on each buy and sell, the commissions would cost me $660.
The program churns through around 3,500 stocks (NYSE and NASDAQ) looking for good trades. It's a lucky day when it finds two picks in a given day.
For those who are interesting..here are the last 10 or so picks it spit out.

I'm at a loss on how to further test the program to ensure this is not some coincidence. Any suggestions?
Monday, August 6
Notes on Reading Stock Chart
Regular Chart Patterns - Learn them
Please note: I am not a financial advisor, take all you read here with a grain of salt.
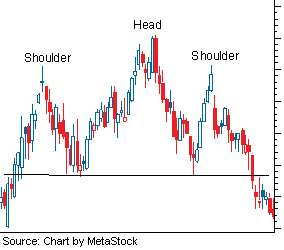
Head and Shoulders - picture
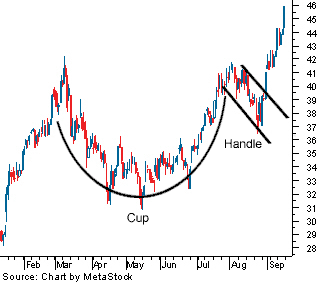
Cup and Handle - picture
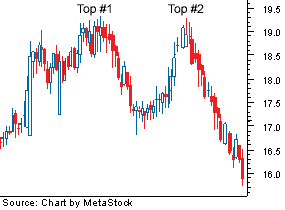
Double Top, Double Bottom - picture
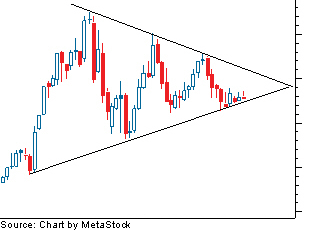
Symmetrical Triangle - picture
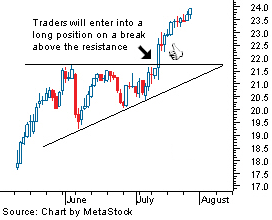
Ascending Triangle - picture
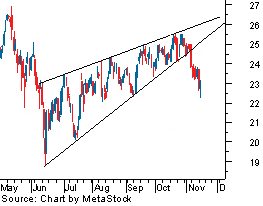
Wedge - picture
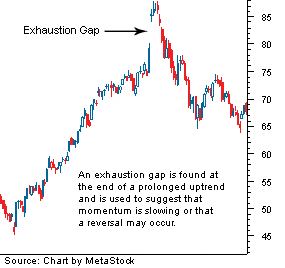
Gap - picture
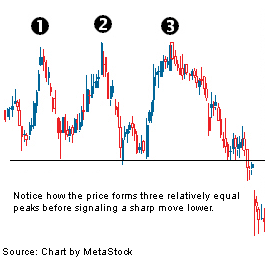
Triple Top - picture
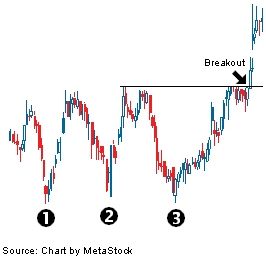
Triple Bottom - picture
References:

Please note: I am not a financial advisor, take all you read here with a grain of salt.
Head and Shoulders - picture
Signals that the price will make a downward move after having moved up in past periods.
Inverse Head and Shoulder signals the opposite
Cup and Handle - picture
Signals that the price will continue in an upward direction after the handle after having moved down in past periods.
Pattern should be a nicely rounded formation, similar to a semi-circle.
The valley should be between one-third and two-thirds the size of the previous upward movement
Double Top, Double Bottom - picture
Sometimes called "Twin Peaks"
Double Top (M) - Signals a downward direction change after moving up in past periods
Double Bottom (W) - Signals an updated direction change after moving down in past periods
Symmetrical Triangle - picture
Signals a consolidation to a given price. Once consolidated it may move in original direction, but it can go in the opposite direction.
Ascending Triangle - picture
Triangle shape, the top of the triangle will be straight. Each "side" of the triangle should be "tested"/"touched" multiple times.
Signals the price is to take an upward direction.
The optimum point to get in on this is right before it moves above the top of the triangle.
Descending Triangle signals the exact opposite.
Wedge - picture
Looks a lot like the symmetrical triangles, however they tend to last over longer periods of time.
Good Question: What's the difference between a wedge and a triangle
Gap - picture
A gap doesn't signify much as far as price trending, other then drastic changes in price.
Triple Top - picture
Trend has to test the same limit 3 times
Trend has to fall to the same support 2 times
Each test of limit will be marked with declining volume
Signals a downward direction
Triple Bottom - picture
Trend has to test the same limit 3 times
Trend has to fall to the same support 3 times
Signals an upward direction
Be careful as this looks just like Triple Top but signals an upward trend.
References:
Investpedia